Source:
US Department of Energy
Published:
2021
Last Updated:
2021
Intended Grade Level:
HS,
Post Secondary
Description:

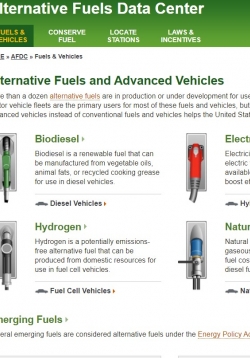
Published by US Department of Energy the Alternative Fuels Data Center is a wealth of data, maps, reports, interactives, case studies, and other resources on existing and emerging alternative fuel technologies, including electric vehicles, biodiesel, natural gas, hydrogen fuel cell, and others. Designed for fleet managers but applicable to high school classrooms, this can be a key research resource for understanding both the science and policy of alternative fuel transportation and applying to real world situations.

Location:
Source:
Renewable Northwest
Published:
2020
Last Updated:
2020
Intended Grade Level:
3-5,
MS,
HS,
Post Secondary
Description:

An interactive map-based listing of major operating, proposed, approved, or other renewable energy projects in the Pacific Northwest US, including owners and generating capacity.

Other Subjects Covered:
Sphero SPRK+

Solar SPRK+ Unit Overview

Grades:
6-8
Unit:
Description:

This unit incorporates basic programming knowledge and solar energy into an engineering design challenge using Sphero SPRK+ robots. The theme for this challenge centers on the idea of Mars rovers, and the challenges faced in space exploration, specifically...

+
-
More Details Less Details
Learning Goal(s):
Students will develop tools to use in the Engineering Design Process.Students will learn drag and drop programming with Sphero Edu (formerly Lightning Lab).Students will determine how series and parallel circuits affect voltage and current.Students will understand how to use photovoltaic sources to charge a SPRK+.Students will design a chariot to carry a photovoltaic power source for a SPRK+.Students will learn to program a SPRK+ ball and chariot through a maze.
Author:
Deb Frankel
Estimated Activity Length:
10 hours
Source:
International Energy Agency
Published:
2020
Last Updated:
2020
Intended Grade Level:
MS,
HS,
Post Secondary
Description:

Explore historical data and forecasts for all renewables sectors and technologies. Renewables 2020 includes a dynamic data dashboard which enables users to explore historical data and forecasts for all sectors and technologies. The associated Renewables 2020 dataset gives full access to all of the data available in this dashboard, plus additional premium data for all sectors and technologies, including additional historical years.

Pedagogy & Practice:
Other Subjects Covered:
Source:
Oregon Department of Energy
Published:
2020
Last Updated:
2020
Intended Grade Level:
3-5,
MS,
HS,
OST
Description:

Energy by the Numbers focuses on the metrics and data available to track how Oregon produces, purchases, and uses various types of energy. Includes many pages of graphics that highlight oregon's energy usage and production by source and by producer/utility type/sector, location of energy facilities, energy costs, and information on electric vehicles in Oregon.

Source:
US Energy Information Administration
Published:
2020
Last Updated:
2020
Intended Grade Level:
HS,
Post Secondary
Description:

(In Beta) A great high-level data tool which provides maps and data on current and historical regional and national electricity usage and generation mix.  Interactive with a variety of downloadable tables and charts that can be generated.

Pedagogy & Practice:
Solar Updraft Tower

Solar Updraft Towers Unit Overview

Grades:
3-8
Description:

Students will combine research, direct observations, and hands-on investigation to lead them into an engineering design project involving the construction of a solar updraft tower. During this process, students will make references to specific phenomena...

+
-
More Details Less Details
Learning Goal(s):
Students will understand ten renewable and non-renewable energy sources on the earth.Students will learn the locations of different energy sources on the earth.Students will learn the history of energy sources and how humans have used them.Students will learn about innovations and inventions used to find, recover, store, and release energy for human consumption.Students will understand that hot air risesStudents will understand why hot water and hot air rise and cold air and cold water sink.Students will learn that wind is produced by warm air rising and cold air sinking.Students will learn that the energy of moving hot air can be converted into other forms of energy.Students will understand that energy from the sun can be converted into heat.Students will discuss the effects of the chimney stack phenomenon.Students will understand that wind energy can be converted into other forms of energy.Students will determine different methods to increase the effectiveness of a wind turbine blade by harnessing and converting the mechanical energy of the wind.Students will determine that thermal energy resulting from the sun’s radiation can create an updraft that will power a turbine to spin.                                       Students will identify characteristics of turbine design that improve the success of their device.Students will utilize content from previous phenomena they investigated, such as the chimney stack effect and Norwegian candle toys, to determine how to best harness the energy transformed by their device from the sun.Students will be able to define and explain what a solar updraft tower is.Students will make connections between their previous engineering challenge and a real world solution to the world’s growing energy demands.
Author:
Lisa Morgan
Estimated Activity Length:
10 hours
Source:
Carbon Brief
Published:
2017
Last Updated:
2020
Intended Grade Level:
HS,
Post Secondary
Description:

Interactive Map featuring sources of energy and consumption. Great tool for engaging students in understanding where their energy comes from locally and from what sources.

Location:
Other Subjects Covered:
Source:
US Energy Information Administration
Published:
2020
Last Updated:
2020
Intended Grade Level:
MS,
HS,
Post Secondary
Description:

A superb research resource for MS and HS students that provides state-by-state data on energy consumption, generation and costs. Also includes state rankings for various energy sources, and individual generation facilities in an interactive map so students can understand what resources and sources of energy and present locally, as well as the grid interconnections. The EIA site also a links to a wealth of other energy data and reports for more detailed analysis, inluding near-term energy forecasts.

Location:
Source:
Department of Energy
Published:
2020
Last Updated:
2020
Intended Grade Level:
3-5,
MS,
HS,
Post Secondary
Description:

National database that allows users to access a wealth of local and state energy information, in both table and graph formats. Data include energy consumption, energy sources, local energy organizations, energy policies, and energy costs. An excellent resource for place-based research.

Location:

Pages